eCOA PLATFORM FOR PAIN ENDPOINTS
Pain, measured the way patients experience it.
The first pain assessment built on animation.
Multidimensional pain data in under two minutes.
Human-centered by design. Digital by origin.
Painimation is a digital-first eCOA platform built around the first pain assessment to use animation, designed with patients around how they experience and express pain. Participants show where pain is, what it feels like, and how strong it is, in any language and at any age. Study teams receive scored, multidimensional pain data in real time.
25+
Clinical and research sites where Painimation has been administered
5
Continents: North America, South America, Europe, Africa, and Asia
<2 min
Average time to complete a full pain assessment
3
Pain dimensions from one report: location, quality, intensity
Painimation captures what a pain score leaves out.
A 0-10 rating records magnitude and nothing else. Painimation records location, quality, and intensity as separate measures, without depending on pain vocabulary, and delivers them inside the daily diary your protocol already requires. Sponsors gain a multidimensional pain endpoint. Participants complete it in under two minutes on their own phone.
Connect with usThe Instrument
Show the pain. Skip the vocabulary.
Participants paint the painful areas on a front and back body map, choose from eight animations that represent pain qualities (shooting, electrifying, throbbing, tingling, cramping, burning, stabbing, pounding), and adjust each animation until it matches what they feel. The animations were derived from McGill Pain Questionnaire descriptors and do not require the participant to read or choose a word.
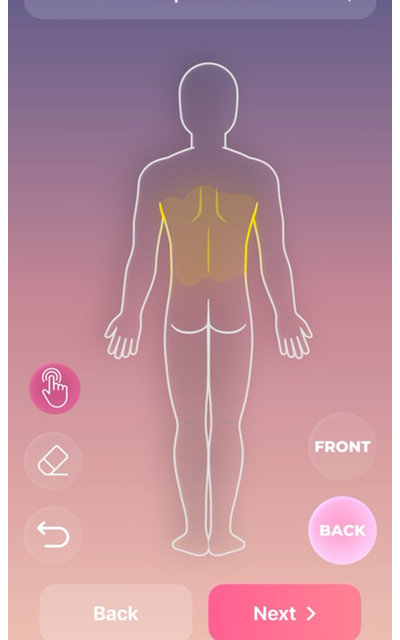
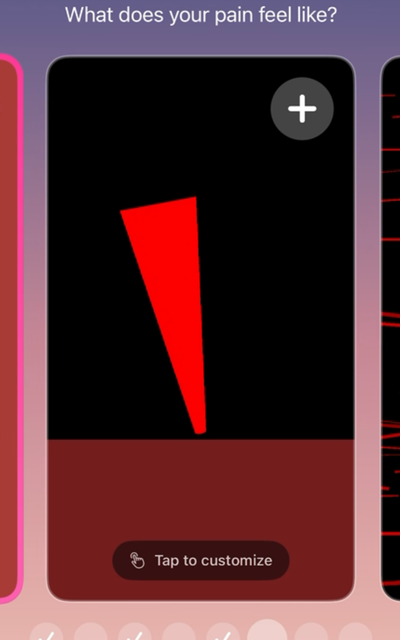
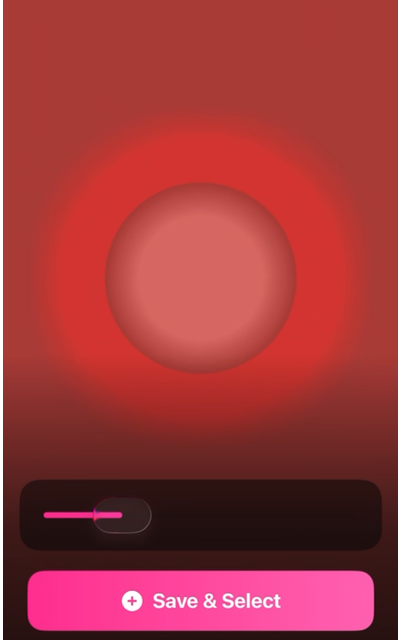
Each report returns body area affected, pain quality, and pain intensity, plus the Painimation Health Score, a 0-100 composite for trials that need a single figure. In a general pain medicine clinic, participants completed the full assessment in under two minutes.
The Diary
One daily check-in. Everything the protocol needs.
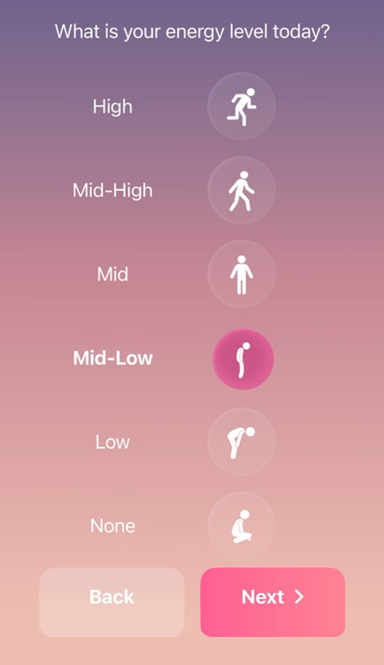
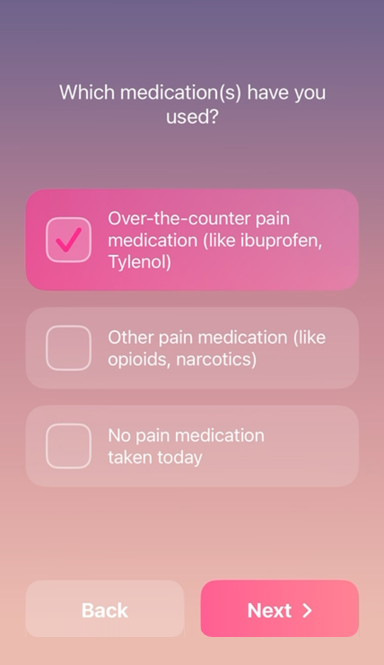
Painimation sits inside a complete daily diary that also records mood, energy and fatigue, and medication use. Standardized questionnaires are scheduled at protocol milestones and delivered in the same app, so participants learn one tool and study teams manage one data stream. Each screen asks one question and answers take a single tap.
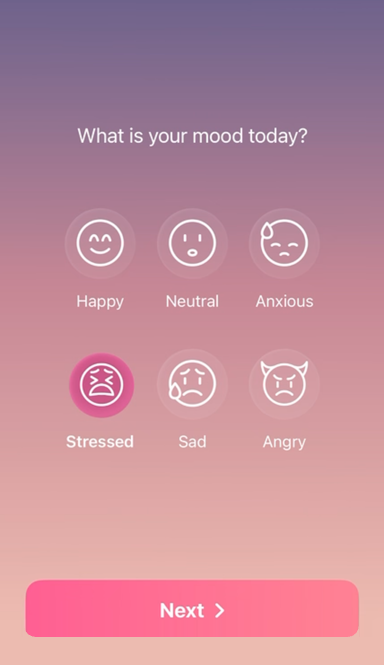
Real-time, scored, and ready for analysis.
Responses are available to the study team as they are entered, already scored. The platform runs on iOS, Android, and web browsers on participants’ own devices, captures data offline and syncs when a connection returns, and deploys updates without an app store reinstall. Painimation runs as a standalone eCOA or as a module inside the sponsor’s or CRO’s existing eCOA system.
Connect with usParticipant Experience
Designed for the realities of chronic pain.
Painimation was built with people living with pain and tested early with adults with sickle cell disease, a population that carries a heavy pain burden and has been poorly served by research tools. Every screen was held to one test: can a participant complete this on a bad pain day?
“Patients felt the painimations were more expressive than words or images alone, had an emotional quality, and even incorporated the fluctuations of pain over time.”
Five design principles
Help the patient describe pain
The tool supports the patient’s own account rather than replacing it.
Make experience count
Patients want their qualitative experience to matter as much as a number. Painimation records both.
Personal
Each participant adjusts the animation to their own pain, and changes can be tracked over time.
Concise
Short and simple to complete, with enough data to guide decisions.
Open the conversation
The report helps patients feel heard and understood by the people treating them.
What Sets Painimation Apart
Human-centered by design. Digital by origin.
Human-centered
Designed with patients, clinicians, and designers around how people experience and express pain, then refined through repeated rounds of user testing.
Digital first
Conceived for a screen. Animation cannot exist on paper, so Painimation is not a paper questionnaire moved onto a tablet.
The first to use animation
Painimation is the first pain assessment that asks patients to choose and adjust animations to show how their pain feels.
Across ages, languages, and cultures
Images and motion replace pain vocabulary, and Painimation has been used with children and adults in the Americas, Europe, Africa, and Asia.
Fast and multidimensional
In under two minutes it returns location, quality, and intensity, information otherwise available only from longer questionnaires.
Evidence
Tested in a multisite trial in sickle cell disease.
See all researchSickle cell disease trials have relied on vaso-occlusive crisis counts and 0-10 pain ratings. Both have proved insensitive to treatment effect, and crisis definitions have varied across trials, which makes results hard to compare.
The CaRISMA trial administered Painimation to adults with sickle cell disease and chronic pain at seven academic medical centers over 12 months, alongside PROMIS and ASCQ-Me measures.
Painimation outputs correlated with pain severity, frequency, interference, and opioid use.
Who We Work With
Sponsors
Trials where the pain endpoint is health care events or the 0-10 rating scale miss where pain occurs and how it feels. Painimation measures change from baseline in body area, pain quality, and intensity, giving small and mid-size biotechs a pain endpoint built with the population rather than borrowed from another.
CROs and eCOA Providers
Painimation adds a differentiated pain instrument to a platform that already has everything else. License the technology, deploy it inside studies you already run, and keep protocol design, site management, and monitoring where they are. We supply the instrument and the scored data. We do not run trials.
Academic Investigators
Investigators license Painimation for their own protocols and keep full control of the study. It has been administered in multisite trials across the United States, Brazil, and France, and in studies in Ghana and Turkey. Where a new population needs validation, we collaborate on the measurement science and co-author the resulting papers.
Frequently Asked Questions
{{ f.a }}
See Painimation in a 20-minute demonstration.
We will walk through the instrument as a participant sees it, the data it returns, and how it fits inside your protocol.